LOWS BREAK, VIX SPIKING - LOOK OUT BELOW? ~ February 23, 2022
Hey all,
I wanted to get out a few charts looking at higher time frames to get an idea of what's going on and what may happen next.
First of all, the lows we've talked about the last few weeks that have held up - well, they no longer are holding.
Both $ES and $NQ lows have broke - see below
$MES/$ES Daily Chart - lows breaking
$MNQ/$NQ Daily Chart - lows breaking
Taking a look at the weekly charts, you can clearly see we have broke the recent lows, both tagging the levels (indicated by the wicks on candles) and now the last couple sessions closing below the recent lows.
We've clearly set highs, broke down through the last line in the sand for
buyers (demand zone ~$4560s), attempted to rally back to the highs/levels
where prices broke down, but couldn't hold.
This to me looks like we are in for more downside to come - at least in the short term.
We'll see what happens now till the Fed's March meeting in 3 weeks when rates are supposed to rise(they already have).
 |
| S&P500 Cash Session Weekly Charts |
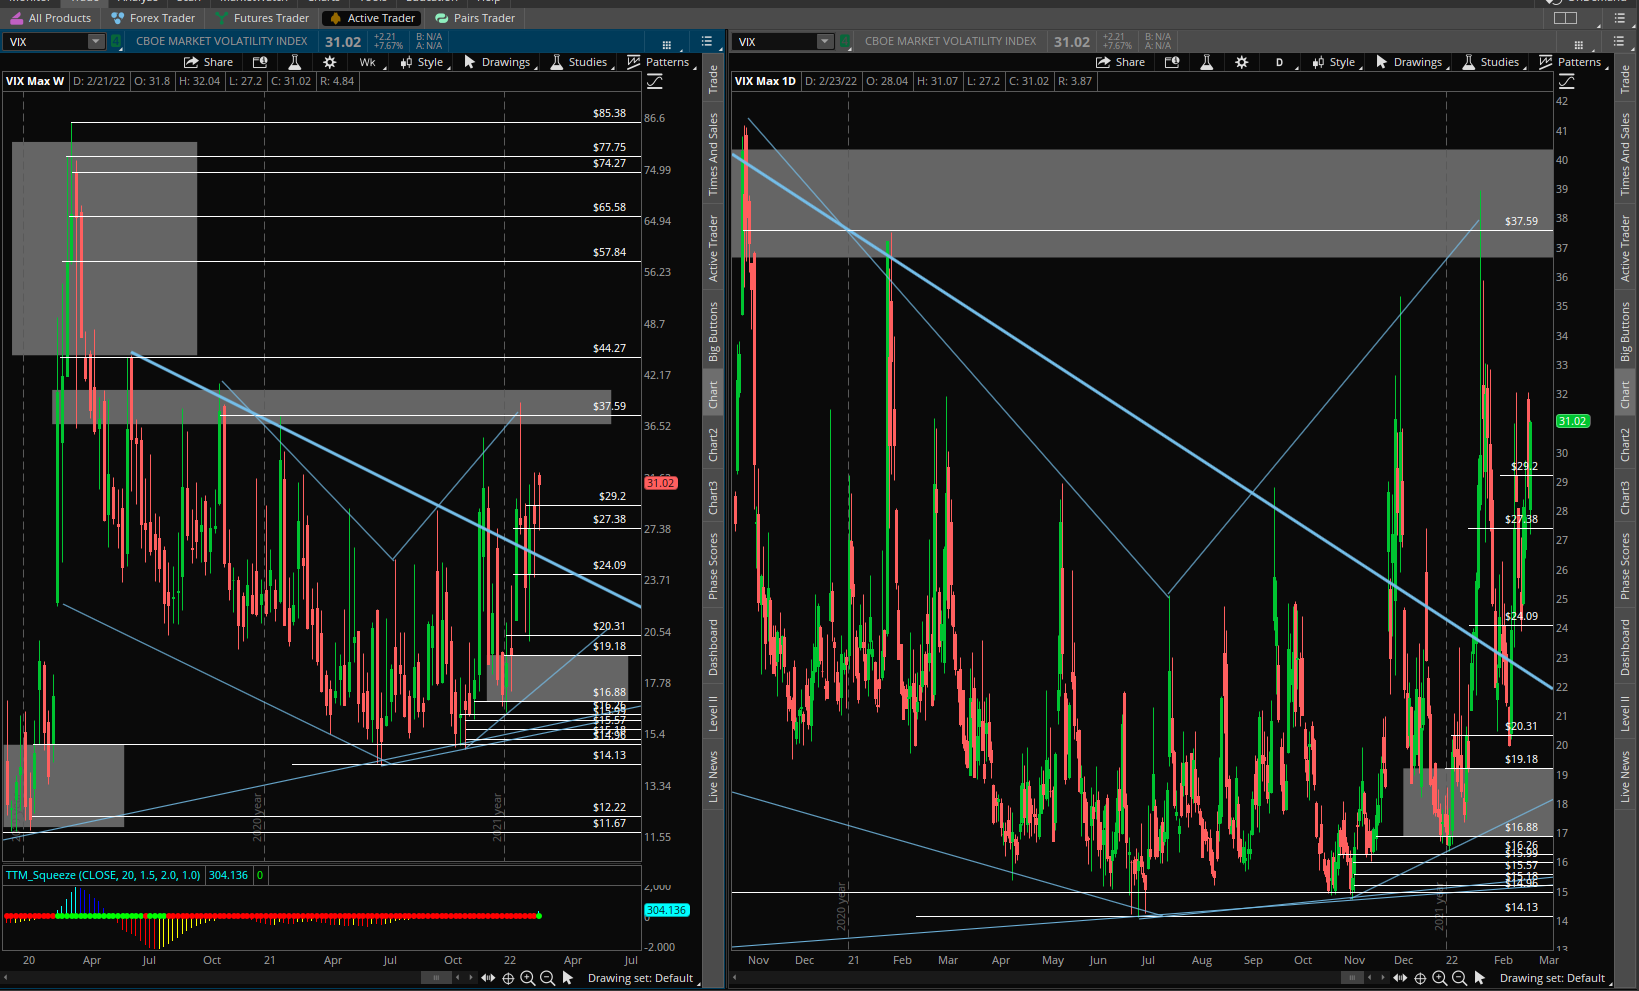
At the same time, the VIX, is building bases and higher lows/higher highs. see below
Both the weekly and daily charts are showing the same thing - VIX is trending higher with a potential for a pop toward 40.
*Full disclosure* We bought some Call Spreads on the VIX for the March 23rd expiration ~ 30 days out.
Crude oil is another market that has been in play as of late, and now we are hitting prices that we haven't seen since 2013-2014.
Watching for a pop above $96-$100 and then wait for a potential short setup.
Finally, gold has been a strong market as of late, breaking out of a recent range . We're currently tagging levels we saw in the middle of last year and 2020.
2021 saw gold selloff hard 2 times to a yearly chart level around $1,685, found support and has been range bound until as of late.
Don't be surprised to see gold pop above $1,950-$1,960s in the short term.
That's it for now, see ya next time!
Let's see how this plays out, lots of things working at the same time for a potential big time move.
See ya!
Jeff


Comments
Post a Comment