Week in Review ~ S&P's Hold A Key Level ==> Look For More Upside Short-Term - January 28, 2022

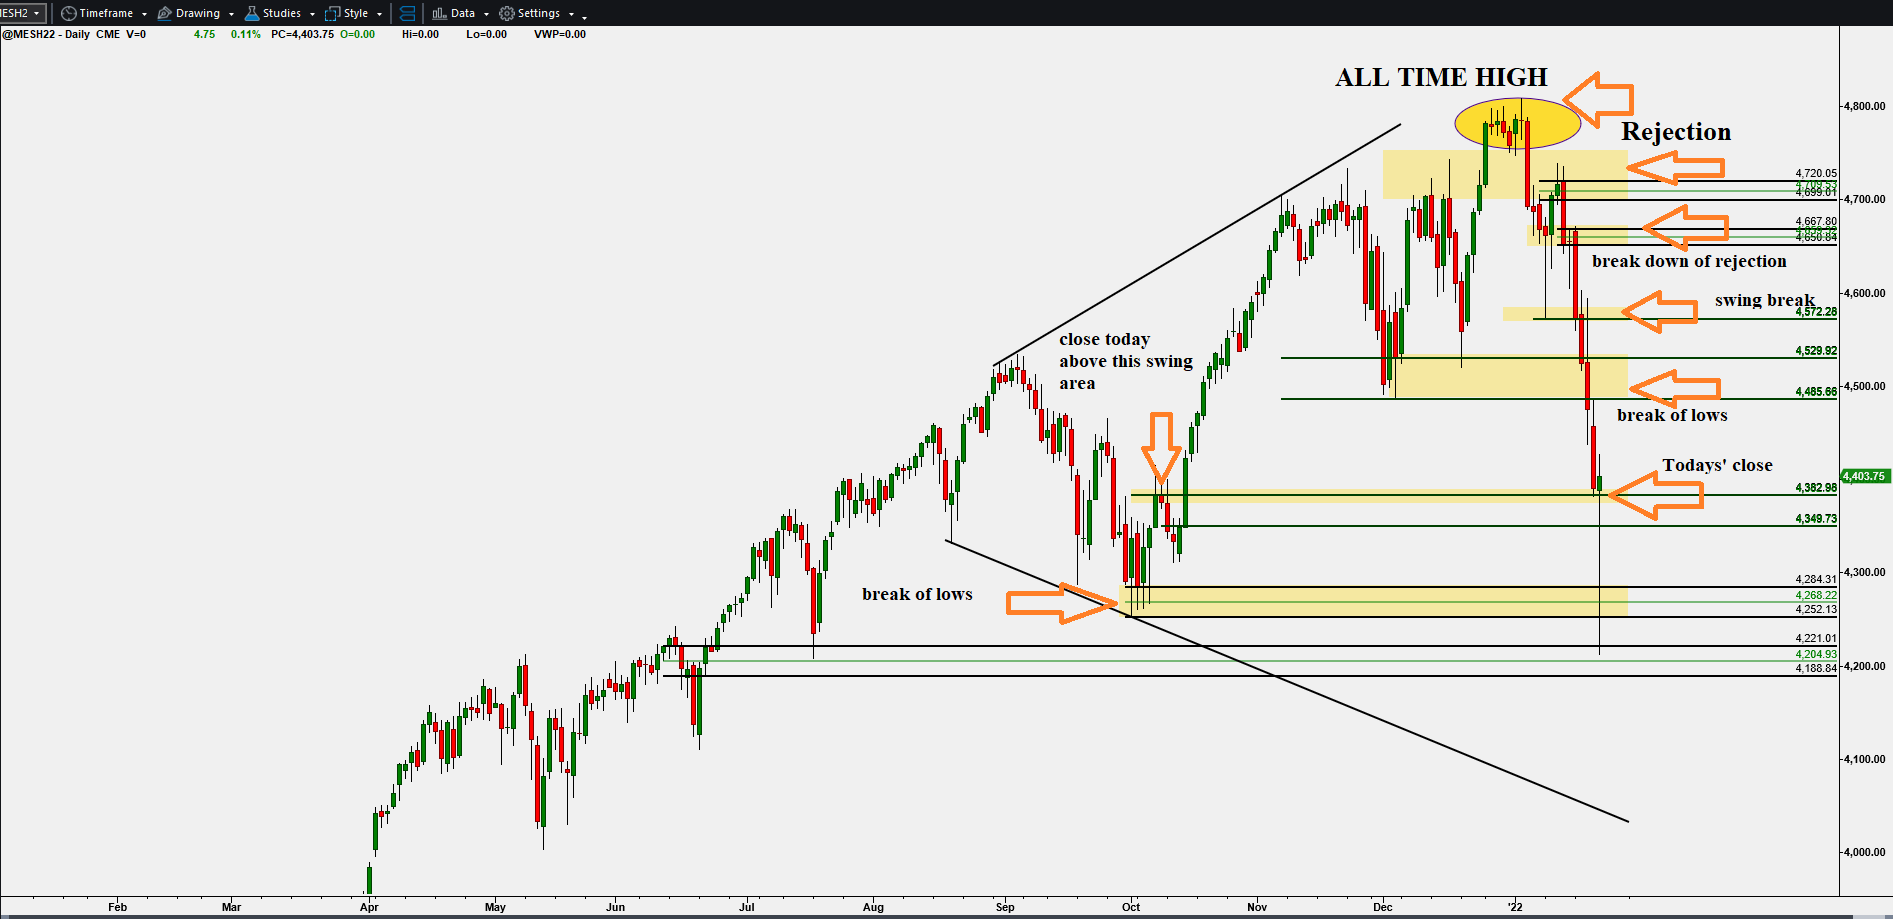
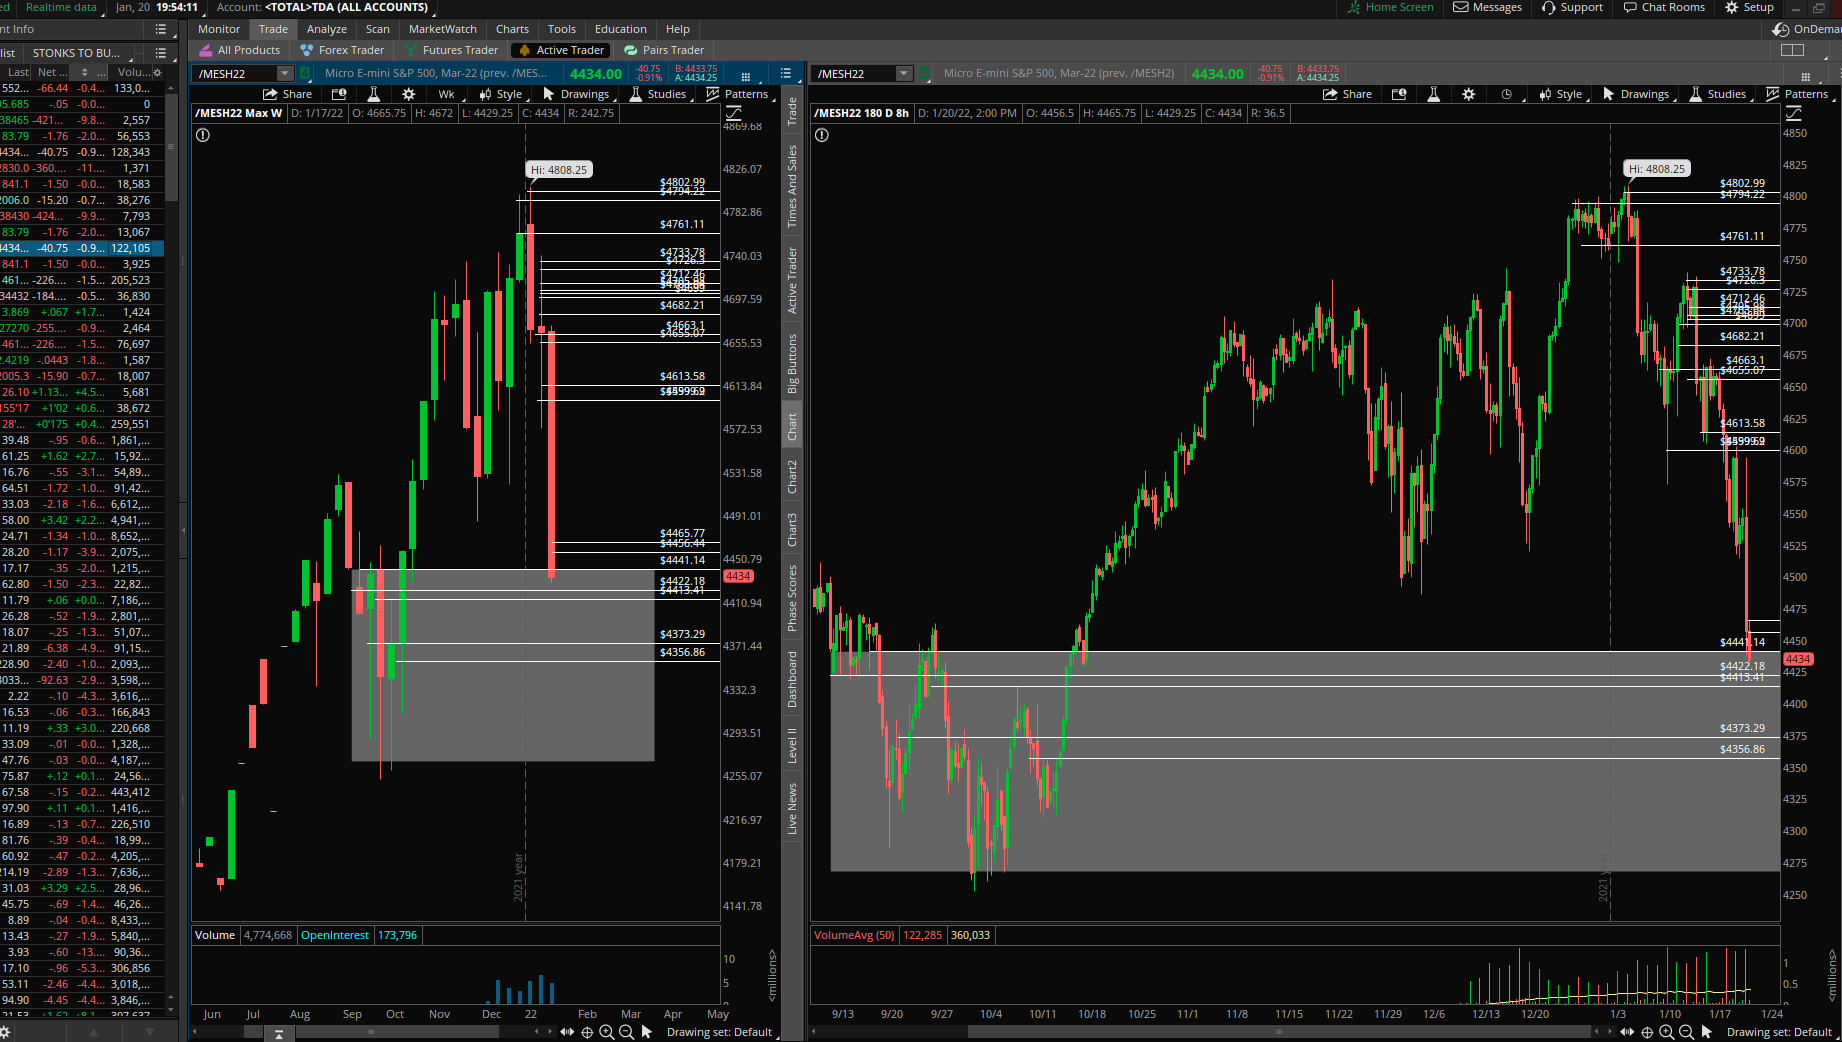
Sorry for the late post, but wanted to cover last week's price action. We talked early on in the week about how the market was testing a previous swing low from October '21 that took us to a new all-time-high. Last week we wanted to see if the $MES/$ES could hold the ~$4,284-$4,300 area on the Daily chart. Looking at the chart below you can see that we clearly violated the level (yellow oval area) but never got a close below ~$4,300 area. With that being said, I'd expect the market to move higher from its current level for a retest ~$4,500 or higher in the near term. US Cash Session Charts For S&P500 On the weekly chart we wanted to see if the $MES/$ES could hold and close above the $4,320s. We got the test below that October swing and tagged a previous area of demand that took us up to new all-time-highs (~$4,200 - $4,220s) for the time being around ~$4,530s. $ES US cash session Weekly Chart If the