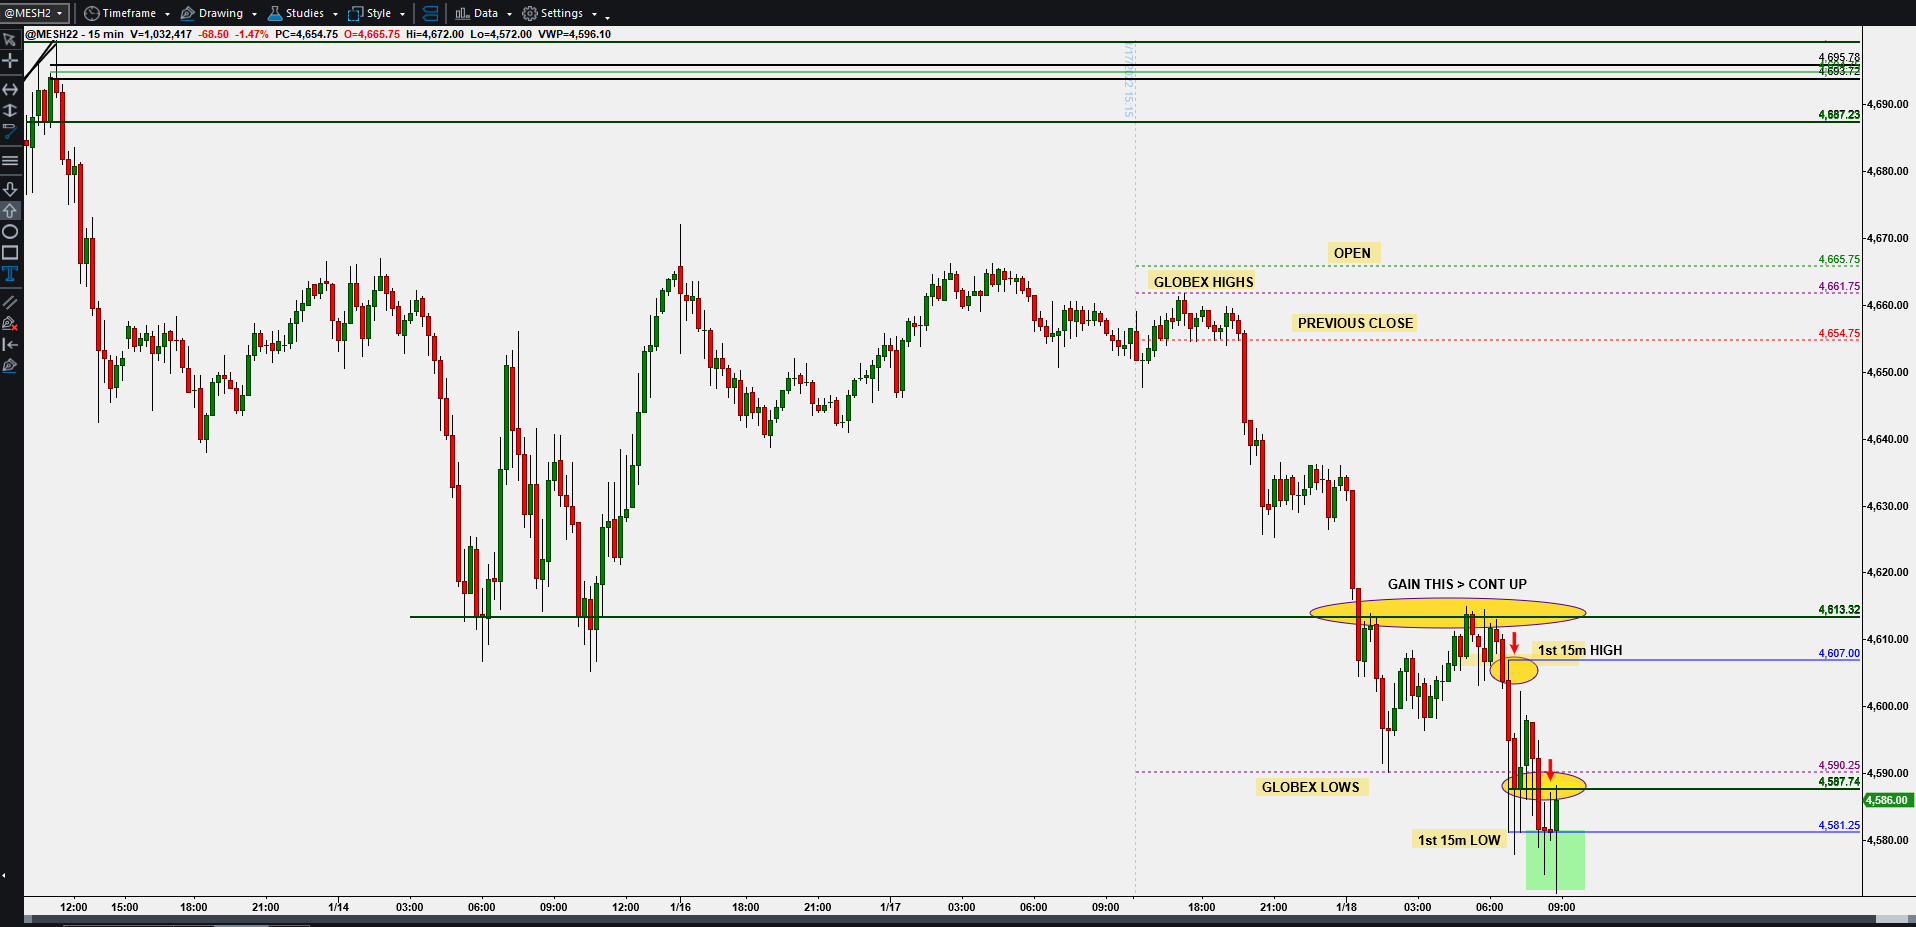
$MES/$ES Chart Review - Tuesday - January 18, 2022
We're back!! Successfully over the battle against Covid and ready to get back to trading. Excited to finally start the year!
The next few posts will be some of the markets we trade with opportunities we currently see.
Let's start with the $ES/$MES from today.
Every morning I start my trading with my 1st 15 Min candle routine where we identify certain price levels, i.e., Globex/Overnight Hi/Lo, Previous Close, Open, and then the 1st 15 min candle of the US Stock market trading hours --> 6:30am-6:45am pst.
The charts below have the levels identified. The thought process for this morning was once the overnight lows broke, we'd wait for an opportunity to get long and reclaim 4613ish.
That did not happen as you can see, but it did set up a few short opportunities (did not take) and then finally the long Low of day retest (see bottom chart).
Charts below show the long entry we took on the Low of Day retest off a higher low (highlighted circle area on 1min chart below).
Prior to taking the trade, we did not KNOW it was going to be the Low of Day, but the probabilities were in our favor.
Minimal risk with a nice reward potential. Took most profits by 4572ish, but the move continued for over 30 points before failing at the Globex/Overnight Lows area.
All-in-all on the Daily Chart the S&P failed to hold its recent All Time High and may have some more room to the downside. Currently sitting in a Daily area of interest for longs, but a break of 4550ish would confirm more downside.
We will have to wait and see. Till next time!
Jeff


Comments
Post a Comment