Posts

Showing posts with the label $ES

CLEAR SKIES ABOVE...? FOMC Day + Interesting Charts $AMD $AMZN $SPY $SPX $TTD $NQ

Image
CLEAR SKIES ABOVE...?  FOMC Day & Charts to Watch Key Takeaways:   The Federal Reserve raised interest rates again today +25bps. Powell signaled that they will likely raise rates again at next month's meeting.  Markets sold off initially, but rallied into the close --> bullish Earnings not that bad + stocks reacting positively to bad news What's all this mean?  At least short term, markets look like they are poised to continue to move higher. Let's take a look at some charts of interest that give us a pretty good idea of what we can expect in the short term.   I posted these charts in our Discord server on January 27, 2023.  I'll post the updated, as of today charts along with those from January 27th.  I'll start with $SPX and $SPY: NASDAQ: A few other interesting charts: $AMD $AMZN $TTD UPDATED CHARTS AS OF FEB 1 2023: Bunch of other stocks, ETF's, sectors, and markets are looking good for opportunities. Tune into the live stream or check out our videos
Video of a live futures trade $MES we took while streaming

Image
 Check out the video below! 👇👇👇

Watch this trade we took live on stream! $MES futures trading

Image
Here's another recent trade we took live on stream! Let me know what you think!

Check out this recent day trade on the $MES we took live on stream!

Image
Check out this recent day trade on the $MES we took live on stream!  

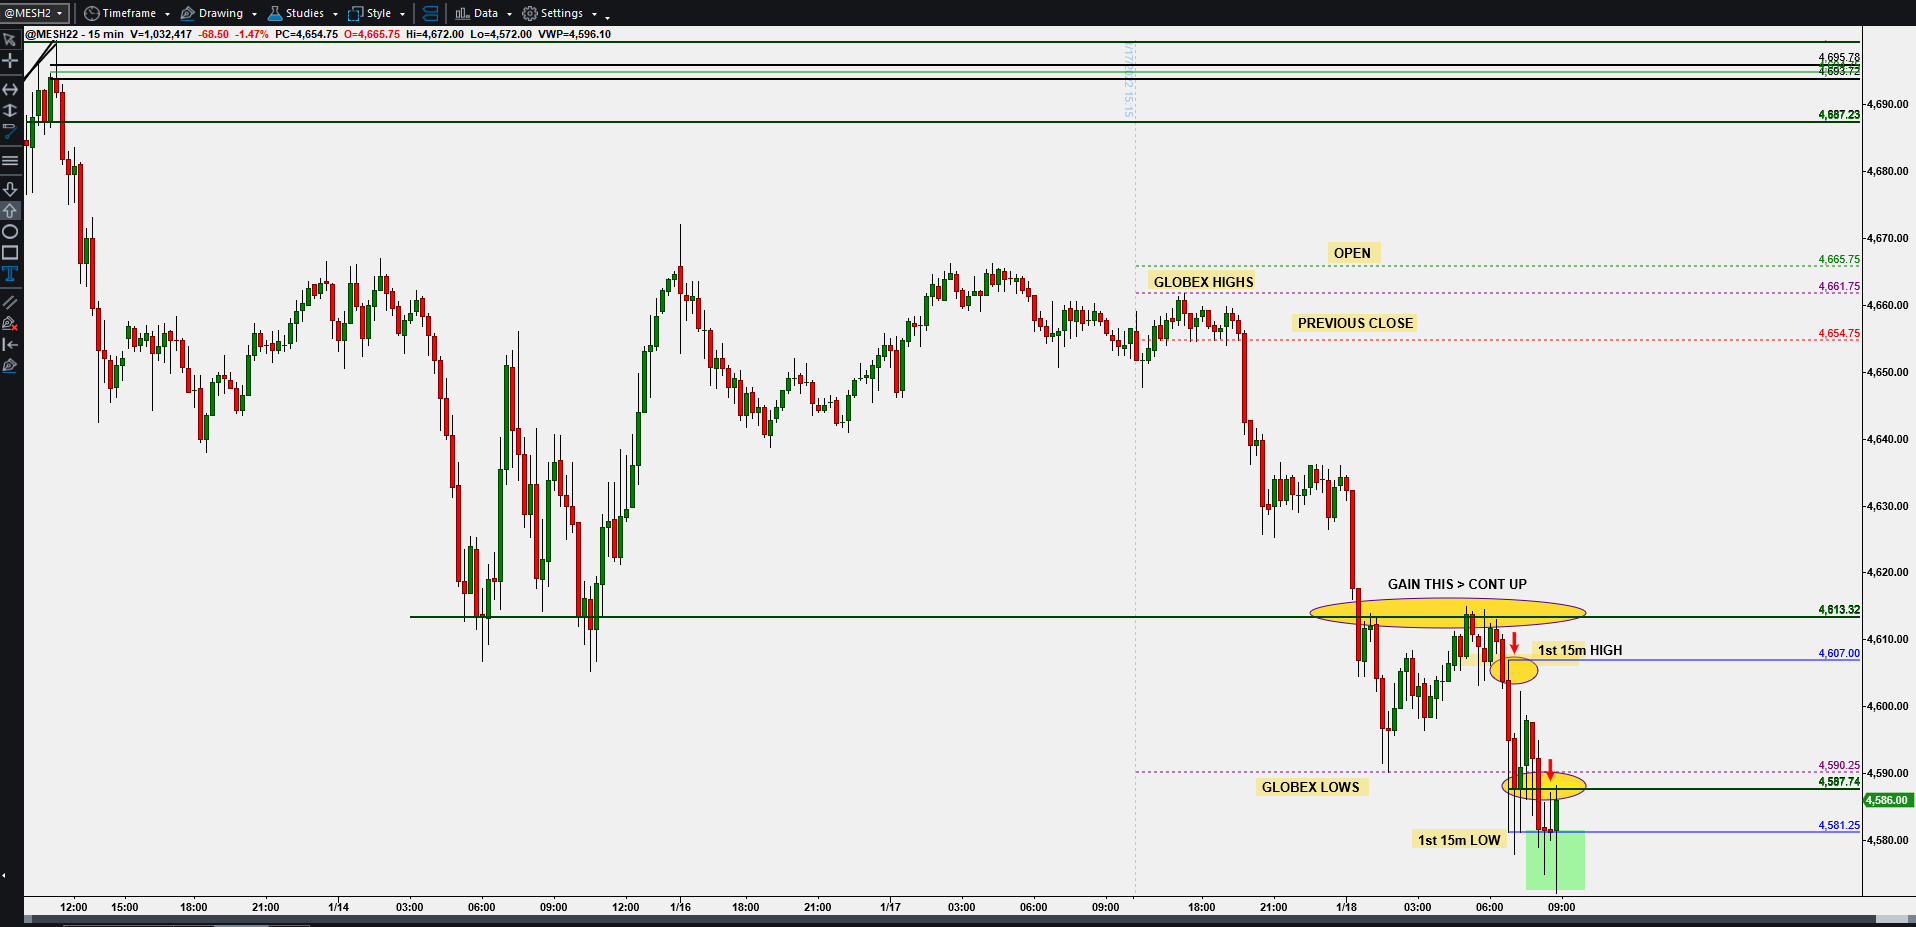
$MES/$ES Chart Review - Tuesday - January 18, 2022

Image
We're back!! Successfully over the battle against Covid and ready to get back to trading. Excited to finally start the year! The next few posts will be some of the markets we trade with opportunities we currently see. Let's start with the $ES/$MES from today.  Every morning I start my trading with my 1st 15 Min candle routine where we identify certain price levels, i.e., Globex/Overnight Hi/Lo, Previous Close, Open, and then the 1st 15 min candle of the US Stock market trading hours --> 6:30am-6:45am pst.  The charts below have the levels identified. The thought process for this morning was once the overnight lows broke, we'd wait for an opportunity to get long and reclaim 4613ish. That did not happen as you can see, but it did set up a few short opportunities (did not take) and then finally the long Low of day retest (see bottom chart). Charts below show the long entry we took on the Low of Day retest off a higher low (highlighted circle area on 1min chart below).  Pr