Posts

Hold-Bounce-Fail-Retest-Fail-Hold...? - February, 15, 2022

Image
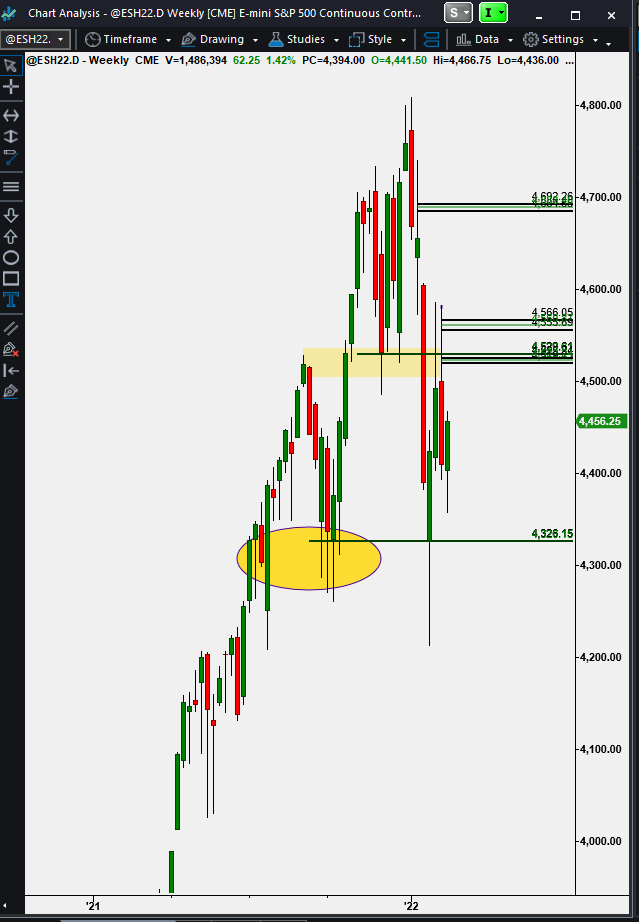
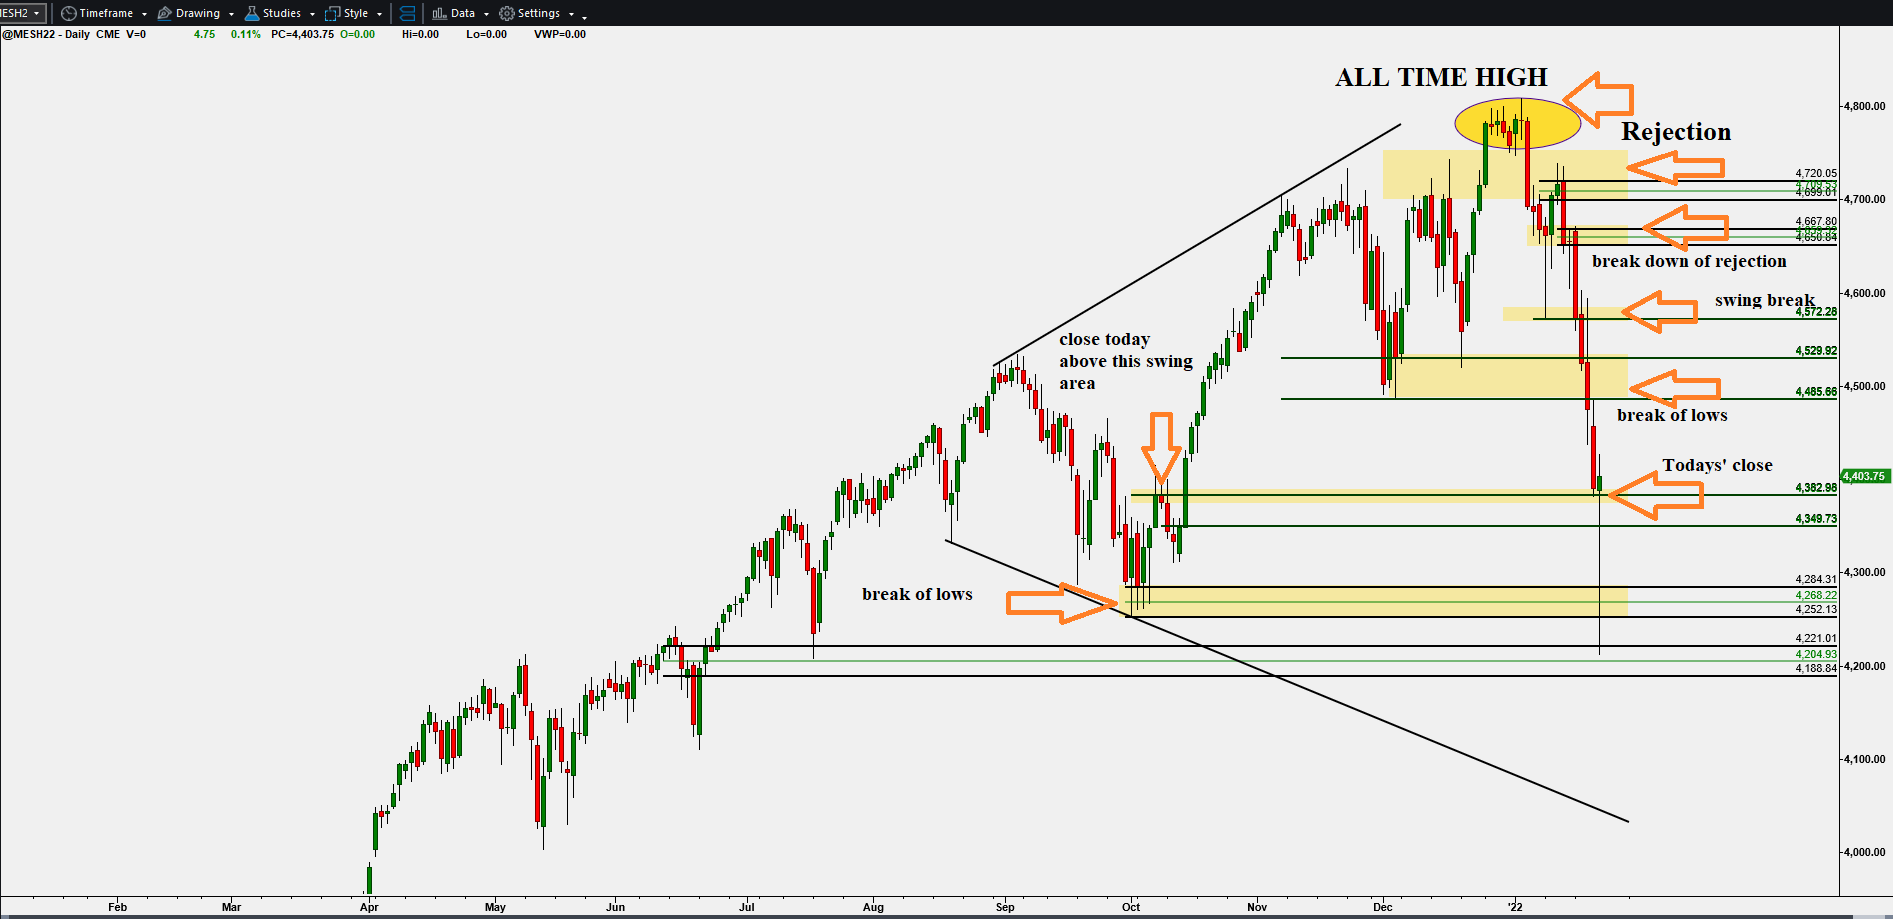
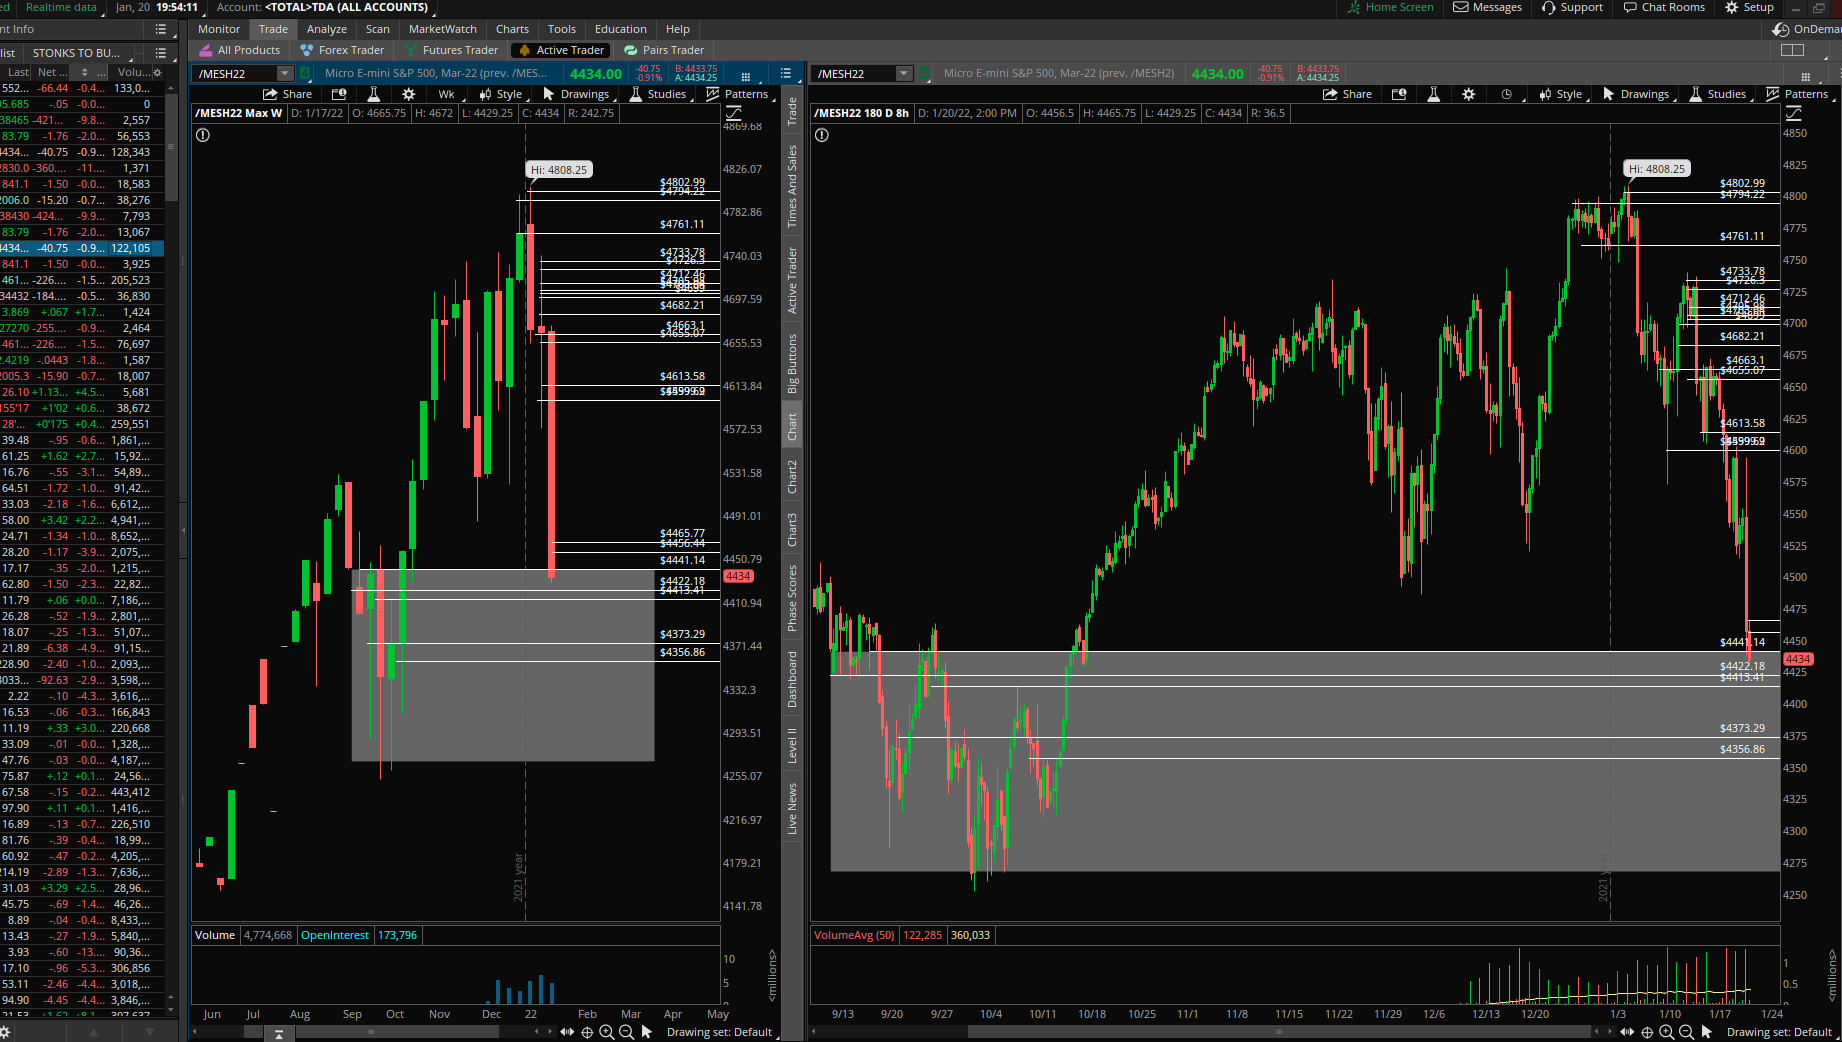
 What Next? Hey guys, just wanted to give an update to the broader markets again, specifically the $MES/$ES and $MNQ/$NQ. Over the last several weeks we talked about the S&P needing to hold a previous weekly/daily swing low area from last October (2021).  * see below* $ES/$MES Weekly Cash Session Chart   So.... we held that level - then bounced - then failed $4550s-$4600 - retested that area - failed again... As you can see from the chart above, we currently are holding the $4300s most recent swing low. So, if we can hold these levels and set a higher low the markets should continue to bounce for a potential takeout and clearing of  +$4600s.  We can also see this price action happening on the $MNQ/$NQ futures contract as well. *see below* $MNQ Daily Chart - Possible higher low forming For the $MNQ/$NQ we want to see the $14000s hold and this possible higher low forming on the daily chart to complete and get a move above $15200s. We will see how the rest of the week plays out, but

Now What? Markets Held, Rallied, & Now...? - February 7, 2022

Image
Where Are We Headed Next? Starting the Week ---> Last week we saw the markets continue to rally off the recent lows with a test of close to $4,600's area. See weekly $ES cash chart below   From the chart above you can also see we started the week inside last weeks trading range, and have stalled out around some previous demand/support levels.  Where are we headed next? Let's look at a Daily chart of the $ES to find some likely areas we can see the markets trade.   From the chart above you can see that we've entered previous areas of support, stalled out and potentially may be setup to pull back a bit in the short term.  If the markets can hold around these prices and show some buying/support, look for a move back to last week's highs. If we fail to hold current prices, look for the move back down to the $4,350's to see if we can hold to create a higher low .  If the higher low forms, look for a move back up to last week's highs and beyond.  If it doesn't,

Week in Review ~ S&P's Hold A Key Level ==> Look For More Upside Short-Term - January 28, 2022

Image
Sorry for the late post, but wanted to cover last week's price action.  We talked early on in  the week about how the market was testing a previous swing low from October '21 that took us to a new all-time-high.  Last week we wanted to see if the $MES/$ES could hold the ~$4,284-$4,300 area on the Daily chart.  Looking at the chart below you can see that we clearly violated the level (yellow oval area) but never got a close below ~$4,300 area. With that being said, I'd expect the market to move higher from its current level for a retest ~$4,500 or higher in the near term. US Cash Session Charts For S&P500 On the weekly chart we wanted to see if the $MES/$ES could hold and close above the $4,320s. We got the test below that October swing and tagged a previous area of demand that took us up to new  all-time-highs (~$4,200 - $4,220s) for the time being around ~$4,530s.                                                                    $ES US cash session Weekly Chart If the

Starting the Week --> Monday, January 24, 2022

Image
 VOLATILITY IS HERE!  Man, what a crazy trading day!  Huge gap down day to start, VIX exploding +30% higher, and then comes the massive dead cat bounce rally.  $MNQ/$NQ rallies over 715 points from the lows and all the indexes reverse to close positive.  Dow rallies, S&P rallies and $IWM rallies to close +2.3%! Very interesting day that had plenty of opportunities on both sides of the market. Let's recap last week before I talk more about today and what potentially I see happening in the short term~ $MES/$ES rejected off recent All time highs and rejected lower to form a new lower high ~ $4650s $MES/$ES broke below $4572, was tested and failed to move lower $MES/$ES broke and failed to hold the $4550-$4500 range, setting us up for a test lower into a weekly swing area from October 2021.  Fast forward to today- huge gap down on both a daily and weekly chart. We gapped down into the recent October 2021 swing low.  We opened in the level, broke the lows, but could not close below

Thoughts on the day ~ S&P500~ Thursday - January 20, 2022

Image
Well, we failed to hold onto the levels from yesterday, and just as we suspected, a move to the 4450s would be up next.  Fast forward into today's close and halt for the Globex session the $MES/$ES hit a low of 4437.75. **At the time of finishing writing this post the market broke those prices and tagged 4330s with more lows looking likely.** So, what does this mean going forward in the short term?   Well, we're currently sitting at an area in price where the $MES previously broke out of a range and ultimately made a new all-time-high. This is the first time back to this price area, so we will see if it holds. If we get a hold at these levels, expect a move back up toward the > $4,600-$4,660 range.  If, we fail to hold this level, more room to the downside makes sense into an area of demand seen on the weekly chart + daily chart gap fill area ==> $4,390-$4,353 on the cash index SPX & ~ $4,373 - $4,340s on $MES/$ES.  With all this volatility comes plenty of opportunity

$MES/$ES Chart & Trade Review - Wednesday - January 19, 2022

Image
 $MES/$ES Chart & Trade Review  - Wednesday - January 19, 2022   Futures Trade of the Day: Just as we did yesterday, another retest of the Low of Day presented itself a couple hours into the trading session.  The long we took turned into a short opportunity later in the day that actually worked out better than our original long entry.  Check out the screen shot below to see the call outs of the trades BEFORE we put them on~~~    Trade Setup : long entry @ 4559.50                              stop loss @ -3.5 points                               target 1 @ +3.5 points                               target 2 @ +6.5 points --> t2 hit, stop loss moves to break even / in profit                               target 3 @ +20 points / trail stop Rationale for trade& setup : 2x time frame opportunity where price was coming down to demand on the 240m chart, with the entry based on the 5m/1m time frame for confirmation of the LOD break, reclaim and retest off a higher low to rally. Targ

$MES/$ES Chart Review - Tuesday - January 18, 2022

Image
We're back!! Successfully over the battle against Covid and ready to get back to trading. Excited to finally start the year! The next few posts will be some of the markets we trade with opportunities we currently see. Let's start with the $ES/$MES from today.  Every morning I start my trading with my 1st 15 Min candle routine where we identify certain price levels, i.e., Globex/Overnight Hi/Lo, Previous Close, Open, and then the 1st 15 min candle of the US Stock market trading hours --> 6:30am-6:45am pst.  The charts below have the levels identified. The thought process for this morning was once the overnight lows broke, we'd wait for an opportunity to get long and reclaim 4613ish. That did not happen as you can see, but it did set up a few short opportunities (did not take) and then finally the long Low of day retest (see bottom chart). Charts below show the long entry we took on the Low of Day retest off a higher low (highlighted circle area on 1min chart below).  Pr