Posts

Video of a live futures trade $MES we took while streaming

Image
 Check out the video below! 👇👇👇

Watch this trade we took live on stream! $MES futures trading

Image
Here's another recent trade we took live on stream! Let me know what you think!

Check out this recent day trade on the $MES we took live on stream!

Image
Check out this recent day trade on the $MES we took live on stream!  

Trading Setup Example Videos on YouTube

Image
If you haven't already, check out all the trading example videos on our YouTube page!  There's a playlist with them all as well. Be sure to like, comment, and subscribe if you find any of the information from those videos or any of the content we put out!  Here's the link: Trading Setup Example Videos   Here's the first video, check it out below!   

Where Are We Now? FED Rate Hike This Week - March 15, 2022

Image
Update On Markets~ FED Rate Decision Tomorrow Since our last post, the markets have continued to trade lower, albeit not in too much of a hurry from a larger time frame perspective (intraday moves have been wild in a lot of markets).  With the FED set to raise rates tomorrow, it'll be interesting to see what they say considering everything going on outside of the markets i.e., Ukraine/Russian War, inflation, spikes in commodities, and potentially headwinds regarding China. Anyway, charts I'm watching going into tomorrow's FED meeting: ^^^$ES/$MES Daily & 4hr charts.           *Looking for a retest lower to ~$4200 before holding to bounce for a bullish close above $4250-$4300.  ^^^ $NQ/$MNQ Daily & 4hr charts.          -Same thing for Nasdaq, retest lower for a hold and bounce to close higher.   ^^^$CL Daily chart          - Crude is still something to watch with opportunities on both sides of the market, longs <$92 and shorts above $105s.  $VIX Weekly & Dail

LOWS BREAK, VIX SPIKING - LOOK OUT BELOW? ~ February 23, 2022

Image
 Hey all, I wanted to get out a few charts looking at higher time frames to get an idea of what's going on and what may happen next. First of all, the lows we've talked about the last few weeks that have held up - well, they no longer are holding.  Both $ES and $NQ lows have broke - see below $MES/$ES Daily Chart - lows breaking   $MNQ/$NQ Daily Chart - lows breaking Taking a look at the weekly charts, you can clearly see we have broke the recent lows, both tagging the levels (indicated by the wicks on candles) and now the last couple sessions closing below the recent lows. We've clearly set highs, broke down through the last line in the sand for buyers (demand zone ~$4560s), attempted to rally back to the highs/levels where prices broke down, but couldn't hold.  This to me looks like we are in for more downside to come - at least in the short term. We'll see what happens now till the Fed's March meeting in 3 weeks when rates are supposed to rise(they alread

Hold-Bounce-Fail-Retest-Fail-Hold...? - February, 15, 2022

Image
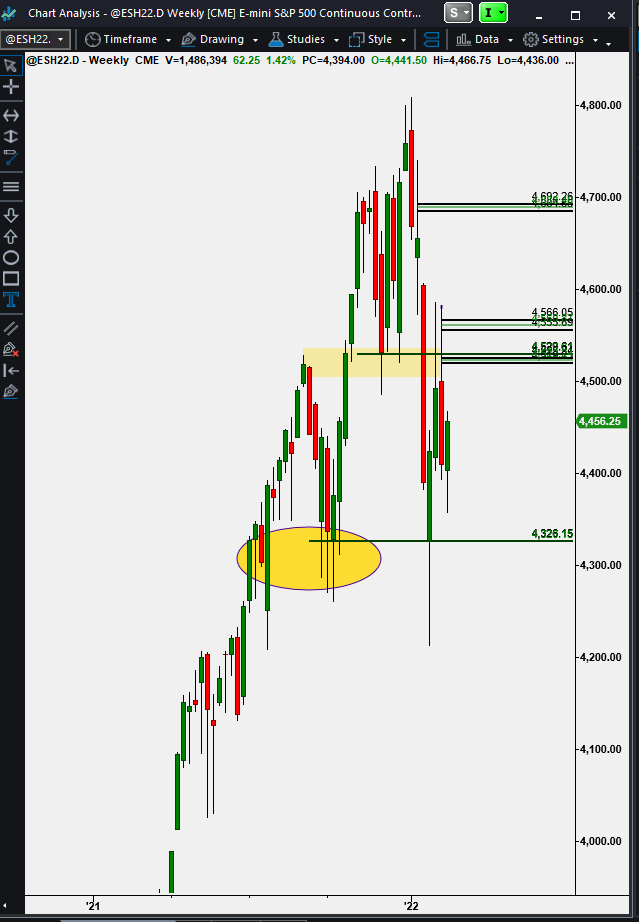
 What Next? Hey guys, just wanted to give an update to the broader markets again, specifically the $MES/$ES and $MNQ/$NQ. Over the last several weeks we talked about the S&P needing to hold a previous weekly/daily swing low area from last October (2021).  * see below* $ES/$MES Weekly Cash Session Chart   So.... we held that level - then bounced - then failed $4550s-$4600 - retested that area - failed again... As you can see from the chart above, we currently are holding the $4300s most recent swing low. So, if we can hold these levels and set a higher low the markets should continue to bounce for a potential takeout and clearing of  +$4600s.  We can also see this price action happening on the $MNQ/$NQ futures contract as well. *see below* $MNQ Daily Chart - Possible higher low forming For the $MNQ/$NQ we want to see the $14000s hold and this possible higher low forming on the daily chart to complete and get a move above $15200s. We will see how the rest of the week plays out, but